According to research gathered by the Ability Programme, Nairobi, Kenya’s capital, is highly inaccessible. The programme set out to record what we believe are the most basic factors that prevent the disabled community from functioning within their environments on a daily basis like:
How easy is it to walk around the CBD if you have a disability?
Is it easy to enter and move around throughout private and public buildings/ spaces?
Do these places, at the very least, have simple accessibility features that are in good enough repair for someone with a disability to use on their own?
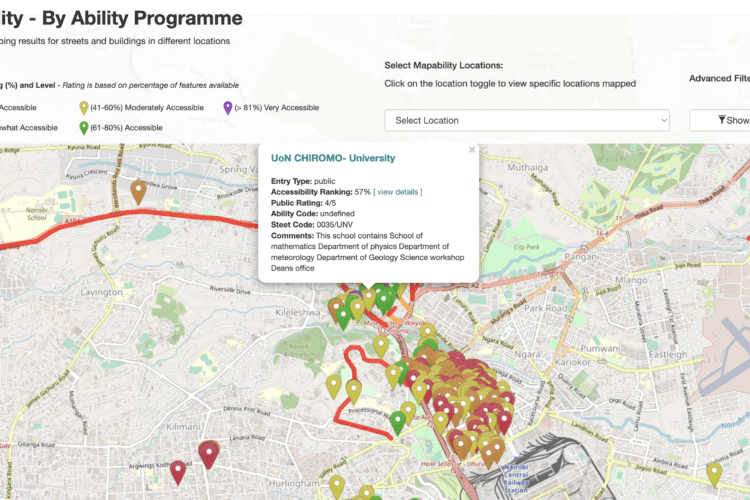
Together with a team of 40 volunteering university students trained, equipped to collect accurate data inside and outside every building, of every street in the 17 zones that were covered in Nairobi’s Central Business District, the spaces were mapped and the data compiled into an OpenStreetMap. The map outlines the level of accessibility of each of these zones.
MapAbility also shows that while some buildings may have accessibility features such as ramps and lifts for instance, they still have a long way to go in terms of making these features user-friendly. Some ramps were too steep, lifts did not work or have auditory prompts and braille, hallways had no clear signage and stairwells were not safe for all. While many streets had pavements, these pavements had uneven flooring, potholes, obstructions such as business sign boards, no tactile paving or working traffic lights.
StayInformed
Sign up for the Ability Program’s monthly newsletter